Abstract
Patients with burn injuries are often initially transported to centers without burn capabilities, requiring subsequent transfer to a higher level of care. This study aimed to evaluate the effect of this treatment delay on outcomes. Adult burn patients meeting American Burn Association criteria for transfer at a single burn center were retrospectively identified. A total of 122 patients were evenly divided into two cohorts—those directly admitted to a burn center from the field vs those transferred to a burn center from an outlying facility. There was no difference between the transfer and direct admit cohorts with respect to age, percentage of total body surface area burned, concomitant injury, or intubation prior to admission. Transfer patients experienced a longer median time from injury to burn center admission (1 vs 8 hours, P < .01). Directly admitted patients were more likely to have inhalation burn (18 vs 4, P < .01), require intubation after admission (10 vs 2, P = .03), require an emergent procedure (18 vs 5, P < .01), and develop infectious complications (14 vs 5, P = .04). There was no difference in ventilator days, number of operations, length of stay, or mortality. The results suggest that significantly injured, high acuity burn patients were more likely to be immediately identified and taken directly to a burn center. Patients who otherwise met American Burn Association criteria for transfer were not affected by short delays in transfer to definitive burn care.
Nearly a half million people in the United States seek treatment for burn injuries each year. An estimated 40,000 of these patients will require hospitalization, with 30,000 of these hospitalizations taking place at tertiary care centers with specialty-focused burn capabilities.1 Many patients suffering burn injuries are initially triaged at centers without burn capabilities, and decisions for transfer are made based on the extent and type of injury.
Burn injuries are a unique form of trauma, resulting in complex, multisystem pathophysiologic derangements. Burn centers have the comprehensive infrastructure and medical personnel required to care for this patient population. The specialty care and resources these facilities provide allows for improved outcomes in high acuity burn patients.2
The American Burn Association (ABA) maintains a list of criteria to aid emergency medical personnel in determining which patients may benefit from transfer to a burn center.3 While the published criteria can be used as a triage tool to guide provider decision making, they are not strict guidelines for transfer.
Patient transfer between hospitals can often take several hours. These delays in transfer can allow for worsening of patient condition, lapses in care, and delays in treatment.4 Conversely, unnecessary transfers with subsequent rapid discharge result in inefficient use of healthcare resources and increase costs and unnecessarily burden patients.5 This study aims to assess whether these transfer-associated treatment delays significantly affect patient outcomes in the treatment of burns.
METHODS
Under an institutional review board-approved protocol, patients meeting criteria for transfer to a burn center were retrospectively identified from a burn registry at University of Louisville Hospital. Published ABA guidelines for referral to a burn center were used as the identifying criteria (Table 1).3 Patients over 18 years who were admitted from 2016 to 2019 were included in the analysis.
American Burn Association burn center referral criteria
| 1. Partial thickness burns greater than 10% TBSA |
| 2. Burns involving face, hands, feet, genitalia, perineum, major joints |
| 3. Third degree burns in any age group |
| 4. Electrical burns, including lightning injury |
| 5. Chemical burns |
| 6. Inhalation injury |
| 7. Burn injury in patients with preexisting medical disorders that could complicate management, prolong recovery, or affect mortality |
| 8. Any patient with burns and concomitant trauma in which the burn injury poses the greatest risk of morbidity or mortality |
| 9. Burned children in hospitals without qualified personnel or equipment for the care of children |
| 10. Burn injury in patients who will require special social, emotional, or rehabilitative intervention |
Cohorts were divided equally between those brought directly to our burn center from the field and those initially taken to an outside facility with subsequent transfer to our burn center. Comprehensive data regarding patient demographics, the mechanism and extent of injury, operations performed, and hospital course were extracted and compared between the two groups. Outcomes between the two cohorts included the rate of infectious complications, the number of ventilator days, the number of emergent (<24 hours after admission) operations (operative debridements) performed, the total number of operations required during the hospital stay, total length of stay (LOS), and mortality.
Statistical calculations were performed using R® software (The R Foundation). Continuous variables were compared using the t test for independent means. Categorical variables were compared using the chi-square or Fisher’s Exact Test, when appropriate. Multivariable logistic regression analysis of significant outcome variables was performed. P values less than .05 were considered significant.
RESULTS
A total of 122 patients were included (Table 2). Median age was 48 years. Most patients (72%) were male. Of the total cohort, 61 (50%) burn patients were directly admitted to our facility and 61 (50%) patients were transferred from outlying hospitals. There was no difference between the groups with respect to gender (P = .84) or age (P = .45).
Patient characteristics
| Total | |
|---|---|
| N | 122 |
| Gender | |
| Male | 88 (72%) |
| Female | 34 (28%) |
| Age (years) | 48 (18–86) |
| Hours from injury to burn center admission | 3 (0.2–144) |
| Injury mechanism | |
| Thermal | 106 (87%) |
| Chemical | 6 (5%) |
| Electrical | 4 (3%) |
| Inhalation | 6 (5%) |
| % TBSA | 10 (0–95) |
Median percent total body surface area burned did not significantly differ between the two groups (10% vs 10%, P = .08) (Table 3). The groups also did not differ in the proportion of patients suffering concomitant injury (0% vs 6.6%, P = .12) or requiring intubation prior to arrival at our facility (8.2% vs 11.5%, P = .76).
Cohort characteristics and injury details
| Direct Admit | Transfer | P | |
|---|---|---|---|
| N | 61 | 61 | |
| Gender | |||
| Male | 45 (74%) | 43 (70%) | .84 |
| Female | 16 (26%) | 18 (30%) | |
| Age (years) | 46 (20–86) | 52 (18–79) | .45 |
| Hours from injury to burn center admission | 0.95 (0.2–1.5) | 8 (2–144) | <.01 |
| Injury mechanism | |||
| Thermal | 51 (84%) | 55 (90%) | .42 |
| Chemical | 3 (5%) | 3 (5%) | |
| Electrical | 2 (3%) | 2 (3%) | |
| Inhalation | 5 (8%) | 1 (2%) | |
| % TBSA | 10 (0–95) | 10 (0–30) | .08 |
| Concomitant injury | 4 (7%) | 0 (0%) | .12 |
| Inhalation burn | 18 (30%) | 4 (7%) | <.01 |
| Intubated prior to admission | 7 (11%) | 5 (8%) | .76 |
| Intubated after admission | 10 (16%) | 2 (3%) | .03 |
There was no difference between the groups with respect to ventilator days (9 vs 3 days, P = .37), total number of operations (0 vs 0, P = .16), total LOS (3 vs 3 days, P = .44), disposition (home [74% vs 85%], subacute rehabilitation facility [10% vs 10%], long-term acute care facility [3% vs 0%], other disposition [3% vs 0%]), or mortality (10% vs 5%, P = .50) (Table 4).
Patient outcomes
| Direct Admit (n = 61) | Transfer (n = 61) | P | |
|---|---|---|---|
| Days on ventilator | 9 (1–48) | 3 (1–22) | .37 |
| Required emergency operation (<24 h after admission) | 18 (30%) | 5 (8%) | <.01 |
| Total number of operations | 0 (0–18) | 0 (0–8) | .16 |
| Infectious complications | 14 (23%) | 5 (8%) | .04 |
| Pneumonia | 5 (8%) | 0 (0%) | .06 |
| Urinary tract infection | 1 (2%) | 0 (0%) | .5 |
| Skin/soft-tissue infection | 7 (11%) | 4 (7%) | .36 |
| Bacteremia | 2 (3%) | 1 (2%) | .62 |
| Length of stay (days) | 3 (1–85) | 3 (1–51) | .44 |
| Disposition | |||
| Home | 45 (74%) | 52 (85%) | .24 |
| Subacute rehab facility | 6 (10%) | 6 (10%) | |
| Long-term acute care facility | 2 (3%) | 0 (0%) | |
| Death | 6 (10%) | 3 (5%) | |
| Other | 2 (3%) | 0 (0%) | |
| Mortality | 6 (10%) | 3 (5%) | .5 |
Transfer patients came from a median of 42 miles (range 0.2–266 miles) from our facility (Figure 1) and experienced a longer median time from injury to burn center admission than directly admitted patients (1 vs 8 hours, P < .01) (Table 4). Directly admitted patients were more likely to have inhalational injury (30.0% vs 6.6%, P < .01), require intubation after admission (16.4% vs 3.3%, P = .03), require an emergent procedure (30.0% vs 8.2%, P < .01), and develop infectious complications (23.0% vs 8.2%, P = .04). With the exception of requiring an emergent procedure, these findings remained true on subgroup analysis of patients with less than 15% TBSA burn (Table 5).
Figure 1.
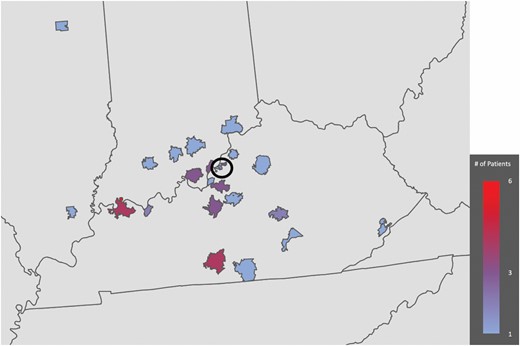
Distance from transferring facilities. Circle denotes county of burn center.
Figure 1.
Distance from transferring facilities. Circle denotes county of burn center.
Subgroup analysis of patients with <15% TBSA burn
| Direct Admit (n = 35) | Transfer (n = 38) | P | |
|---|---|---|---|
| Age (years) | 46 (20–76) | 49 (27–79) | .46 |
| Hours from injury to burn center admission | 1.0 (0.2–2.9) | 18.2 (3–144) | .01 |
| Concomitant injury | 2 (6%) | 0 (0%) | .14 |
| Inhalation burn | 8 (23%) | 2 (5%) | .03 |
| Intubated prior to admission | 3 (9%) | 2 (5%) | .55 |
| Intubated after admission | 4 (11%) | 0 (0%) | .03 |
| Days on ventilator | 6 (1–13) | 2 (1–3) | .22 |
| Required emergent operation (<24 h after admission) | 5 (14%) | 2 (5%) | .18 |
| Total number of operations | 0.5 (0–5) | 0.4 (0–2) | .50 |
| Infectious complications | 7 (20%) | 1 (3%) | .02 |
| Length of stay (days) | 6 (1–46) | 4 (1–19) | .50 |
| Disposition | |||
| Home | 33 (94%) | 36 (95%) | .80 |
| Subacute rehab facility | 1 (3%) | 2 (5%) | |
| Long-term acute care facility | 0 (0%) | 0 (0%) | |
| Death | 0 (0%) | 0 (0%) | |
| Other | 1 (3%) | 0 (0%) | |
| Mortality | 0 (0%) | 0 (0%) | NA |
On subgroup analysis of patients with greater than 15% TBSA burn (Table 6), transfer patients again experienced longer time from injury to burn center admission (1.4 vs 10 hours, P = .03). Directly admitted patients were still more likely to have inhalational injury (38% vs 9%, P = .02) and require an emergent procedure (50% vs 13%, P < .01). However, there was no difference between the two groups with respect to requiring intubation after admission (23% vs 9%, P = .20) or developing infectious complications (27% vs 17%, P = .51).
Subgroup analysis of patients with >15% TBSA burn
| Direct Admit (n = 26) | Transfer (n = 23) | P | |
|---|---|---|---|
| Age (years) | 47 (24–86) | 49 (20–72) | .74 |
| Hours from injury to burn center admission | 1.4 (0.3–3.3) | 10.0 (2–48) | .03 |
| Concomitant injury | 2 (8%) | 0 (0%) | .17 |
| Inhalation burn | 10 (38%) | 2 (9%) | .02 |
| Intubated prior to admission | 4 (15%) | 3 (13%) | .86 |
| Intubated after admission | 6 (23%) | 2 (9%) | .20 |
| Days on ventilator | 12 (1–48) | 9 (1–22) | .53 |
| Required emergent operation (<24 h after admission) | 13 (50%) | 3 (13%) | < .01 |
| Total number of operations | 3 (0–18) | 2 (0–8) | .26 |
| Infectious complications | 7 (27%) | 4 (17%) | .51 |
| Length of stay (days) | 17 (1–85) | 15 (1–51) | .72 |
| Disposition | |||
| Home | 12 (46%) | 16 (70%) | .37 |
| Subacute rehab facility | 5 (19%) | 4 (17%) | |
| Long-term acute care facility | 2 (8%) | 0 (0%) | |
| Death | 6 (23%) | 3 (13%) | |
| Other | 1 (4%) | 0 (0%) | |
| Mortality | 6 (10%) | 3 (5%) | .5 |
On multivariable analysis controlling for age, concomitant injuries, and percentage of total body surface area burned, the greater frequency of inhalational injury and emergent procedures for directly admitted patients remained significant (Table 7).
Multivariable analysis of associations between transfer status and outcome variables
| Odds Ratio | 95% CI | P | |
|---|---|---|---|
| Inhalation burn | 0.21 | 0.061–0.719 | .01 |
| Intubated after admission | 0.34 | 0.060–1.939 | .23 |
| Required emergent operation (<24 h after admission) | 0.31 | 0.096–0.976 | .05 |
| Infectious complications | 0.38 | 0.119–1.192 | .1 |
| Odds Ratio | 95% CI | P | |
|---|---|---|---|
| Inhalation burn | 0.21 | 0.061–0.719 | .01 |
| Intubated after admission | 0.34 | 0.060–1.939 | .23 |
| Required emergent operation (<24 h after admission) | 0.31 | 0.096–0.976 | .05 |
| Infectious complications | 0.38 | 0.119–1.192 | .1 |
DISCUSSION
Delayed transfer of patients with burn injuries to facilities with burn-specific capabilities runs the risk of adversely affecting patient outcomes. Our study indicates that patients with more severe, higher acuity injuries, such as those with inhalation injury and those who ultimately required intubation, were more likely to be taken directly from the field to our burn facility. For patients with less severe, lower acuity injuries who otherwise met ABA criteria for transfer to a burn center, short delays in transfer did not affect overall patient outcomes.
Adequate burn care is reliant upon the recognition and understanding of the nature and extent of the burn injury. For example, knowledge of the burn mechanism, depth of burn, total body surface area affected, and the presence of concomitant injuries, including inhalation injury, are key metrics in guiding the management of the burned patient. A recent meta-analysis reviewed 37 studies evaluating care prior to arrival at burn centers and found that errors were common, with frequent overestimation of burns ranging from 75% to 3500%, unnecessary intubation in up to one half of patients, over-administration of intravenous fluids, and inadequate application of basic dressings.6 Without an ability to recognize and act on these key metrics, there is a distinct potential for patient harm if transfer to a burn center is delayed.
A number of international studies have examined the effects of transfer delays in burn patients, revealing varied results. One study found that while rural populations within British Columbia experienced an increased total risk of mortality, transfer status did not affect inpatient mortality or LOS.7 Likewise, time to admission to a burn center did not influence outcomes in Australia and New Zealand, with the exception of a time of >16 hours to definitive care in the case of inhalation injury.8 In contrast, a German study found that patients admitted specifically to burn intensive care units as transfers experienced a longer time to first burn debridement, longer ventilator days, and longer total LOS than those admitted directly. Mortality rates, however, were not different between the groups.9
These studies examined the effects of burn transfers within the context of each individual country’s emergency response system and inter-hospital transfer apparatus, which are not necessarily comparable to those in place in the United States. While some have performed similar studies within the context of the U.S. healthcare system, they have been performed in the pediatric population and examined the effects of longer delays in transfer to burn centers.10,11 Our study evaluated the adult burn population within the United States. Within the context of short delays in transfer, there was no discernable difference in outcomes between those who were admitted directly to a burn center and those who were seen at outlying facilities prior to transfer.
The implications of these findings are significant in terms of cost and resource utilization. A study examining costs found that unnecessary transfers accounted for nearly one third of the burn admissions at their facility and comprised nearly one fifth of the cost associated with their transfers.12 Our findings indicate that patients with significant burn injury and/or compromised airways were more likely to be promptly identified and taken directly to a burn center. However, for patients with lower acuity burns, initial triage at an outlying facility may present an opportunity to avoid unnecessary transfers and ultimately decrease cost and resource utilization without harming patients. This is particularly true with the advent of telemedicine.
A study at our institution found that communication between critical access centers and tertiary referral centers is often insufficient, resulting in frequent unnecessary transfers.13 The use of telemedicine and image-sharing has been shown to enhance this communication within the trauma system.14 Similarly, telemedicine has been shown to improve the assessment of burn patients at non-burn facilities and re-direct their management when needed.15 At our institution, we are expanding on these findings to facilitate remote burn care within our region. We are currently developing a burn referral line to be available for use by critical access centers at all hours. This will include video evaluation of burn injuries by the on-call provider at our facility. We have also developed telemedicine burn care courses for first responders and referring centers. Similar educational programs have been implemented elsewhere for providers in resource-limited areas in the setting of generalized trauma and have been shown to better optimize transfer timing.16 Additionally, we have successfully transitioned half of our burn clinic follow-up visits to telemedicine, which is of particular benefit to patients from more remote areas of our region.
This study should be interpreted considering several limitations. It is inherently limited by its retrospective design. In particular, data regarding total intravenous fluid administration was available for only three of our patients. Additionally, because ABA transfer criteria cover a broad range of acuity, this may have hindered our ability to detect a difference in outcomes amongst the most ill patients. However, subgroup analysis of patients with greater than 15% TBSA burns and multivariable analysis controlling for degree of injury were performed to increase the likelihood of detecting such a difference. While our study cohort allowed us to evaluate the effects of short transfer delays (median delay of 8 hours) on outcomes, our data does not speak to the effect of long delays (>24 hours). We also focused on short-term, inpatient outcomes but did not examine the effects of transfer delays on long-term outcomes after discharge.
CONCLUSIONS
This study demonstrates that patients with significant burn injury are more likely to be taken directly to a burn center for definitive burn care. However, for the lower acuity burns, initial triage at a non-burn facility does not negatively affect outcomes. Improving the assessment of burn injuries at outlying facilities may prevent the transfer of burn patients and the associated transfer costs for patients who might otherwise be adequately cared for at a facility without specialized burn care.
Conflict of interest statement. All listed authors of this study have no conflicts of interest or disclosures.
Funding: No funding or financial support was received. This research did not receive any specific grant from funding agencies in the public, commercial, or not-for-profit sectors.
Presented at the 52nd annual American Burn Association meeting, May 2020.
N.E.B. and E.H.B. contributed equally to this manuscript.
REFERENCES
Davis
JS
,
Dearwater
S
,
Rosales
O
et al.
Tracking non-burn center care: what you don’t know may surprise you
.
J Burn Care Res
2012
;
33
:
e263
–
7
.
American Burn Association/American College of Surgeons
.
Guidelines for the operation of burn centers
.
J Burn Care Res
2007
;
28
:
134
–
41
.
Philip
JL
,
Yang
DY
,
Wang
X
et al.
Effect of transfer status on outcomes of emergency general surgery patients
.
Surgery
2020
;
168
:
280
–
6
.
Osen
HB
,
Bass
RR
,
Abdullah
F
,
Chang
DC
.
Rapid discharge after transfer: risk factors, incidence, and implications for trauma systems
.
J Trauma
2010
;
69
:
602
–
6
.
Harshman
J
,
Roy
M
,
Cartotto
R
.
Emergency care of the burn patient before the burn center: a systematic review and meta-analysis
.
J Burn Care Res
2019
;
40
:
166
–
88
.
Bell
N
,
Simons
R
,
Hameed
SM
,
Schuurman
N
,
Wheeler
S
.
Does direct transport to provincial burn centres improve outcomes? A spatial epidemiology of severe burn injury in British Columbia, 2001–2006
.
Can J Surg
2012
;
55
:
110
–
6
.
Cassidy
TJ
,
Edgar
DW
,
Phillips
M
et al.
Transfer time to a specialist burn service and influence on burn mortality in Australia and New Zealand: a multi-centre, hospital based retrospective cohort study
.
Burns
2015
;
41
:
735
–
41
.
Ehrl
D
,
Heidekrueger
PI
,
Ninkovic
M
,
Broer
PN
.
Effect of primary admission to burn centers on the outcomes of severely burned patients
.
Burns
2018
;
44
:
524
–
30
.
Johnson
SA
,
Shi
J
,
Groner
JI
et al.
Inter-facility transfer of pediatric burn patients from U.S. Emergency Departments
.
Burns
2016
;
42
:
1413
–
22
.
Sheridan
R
,
Weber
J
,
Prelack
K
,
Petras
L
,
Lydon
M
,
Tompkins
R
.
Early burn center transfer shortens the length of hospitalization and reduces complications in children with serious burn injuries
.
J Burn Care Rehabil
1999
;
20
:
347
–
50
.
Austin
RE
,
Schlagintweit
S
,
Jeschke
MG
,
MacDonald
R
,
Ahghari
M
,
Shahrokhi
S
.
The cost of burn transfers: a retrospective review of 7 years of admissions to a regional burn center
.
J Burn Care Res
2018
;
39
:
229
–
34
.
Bruenderman
EH
,
Block
SB
,
Kehdy
FJ
et al.
An evaluation of emergency general surgery transfers and a call for standardization of practices
.
Surgery
2021
;
169
:
567
–
72
.
Rogers
FB
,
Ricci
M
,
Caputo
M
et al.
The use of telemedicine for real-time video consultation between trauma center and community hospital in a rural setting improves early trauma care: preliminary results
.
J Trauma
2001
;
51
:
1037
–
41
.
Wibbenmeyer
L
,
Kluesner
K
,
Wu
H
et al.
Video-enhanced telemedicine improves the care of acutely injured burn patients in a rural state
.
J Burn Care Res
2016
;
37
:
e531
–
8
.
Dennis
BM
,
Vella
MA
,
Gunter
OL
et al.
Rural Trauma Team Development Course decreases time to transfer for trauma patients
.
J Trauma Acute Care Surg
2016
;
81
:
632
–
7
.
Published by Oxford University Press on behalf of the American Burn Association 2021.
This work is written by (a) US Government employee(s) and is in the public domain in the US.